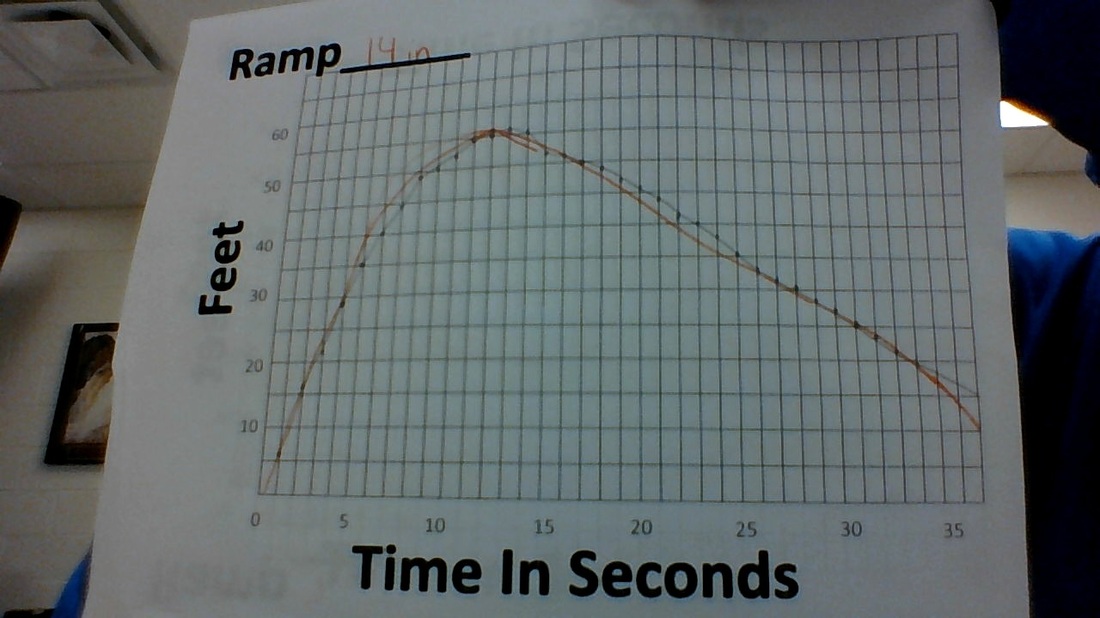
This graph shows the feet per second a skateboard went down a 14 inch ramp on a concrete driveway. The orange is my prediction and the pencil is the actual. The graph going up is where it went down the ramp and up the hill and where it goes down is where the skateboard rolled back down the hill.
A.) My prediction to the actual graph was really close. I was only off a little bit at certain points. What led me to predicting my graph like this was watching the skateboard hit all of the points in the video and predicting those points.
B.) The domain of the graph is (0,37) and the range is (0,56)
C.) The zeros are all the same because the zero is where all of the graphs started. The maximums are different because the higher the ramp the higher the maximum. The minimums are all the same at zero because that is the lowest of the graph and where it started. The 21 and 14 inch graphs are similar because they increased pretty fast and went back down the hill. The 7 inch graph is different because it stopped at its maximum because it did not roll back down the hill.
D.) The slope of the graph is rising the fastest when it comes down the ramp and starts going up the hill. After it reaches the maximum it slopes down because it starts rolling back down the hill.
 RSS Feed