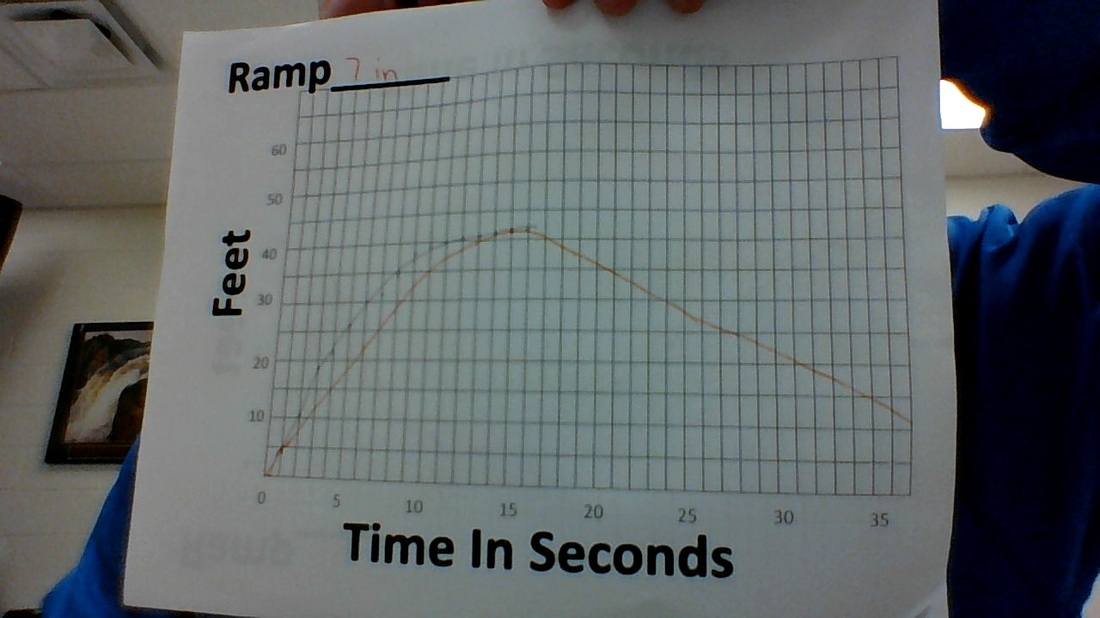
This graph shows how many feet per second a skateboard went going down a 7 inch ramp and up a hill on a concrete driveway. My prediction was the orange and the actual was the pencil. The skateboard went up pretty fast but it didn't go back down the hill like had predicted.
A.) My prediction to the actual graph was a little off. My graph was a little different because I increased my line a little to slow. My initial reasoning was that the skateboard slowly started coming down but the video stopped because the skateboard never moved, but i wasn't able to see this because the video stopped to soon.
B.) The domain of the graph is (0,16) and the range is (0,42).
C.) The zeros are all the same because the zero is where all of the graphs started. The maximums are different because the higher the ramp the higher the maximum. The minimums are all the same at zero because that is the lowest of the graph and where it started. The 21 and 14 inch graphs are similar because they increased pretty fast and went back down the hill. The 7 inch graph is different because it stopped at its maximum because it did not roll back down the hill.
D.) The graph rose the fastest from 0-5 seconds because of the ramp then it went at a constant speed. It didn't fall at all because the skateboard didn't roll back down the hill
 RSS Feed